
Reporting & investor insight
Insight into your asset — not just information about it.
Our reporting capability is how owners see what their property is actually doing: where income is heading, what is exposed, and which decisions are next. Monthly statements, annual investor reporting and a live dashboard, all drawn from the same records.
Reporting Dashboard
Sign in to your property.
Current financials, lease information, key dates, documents and maintenance activity — available whenever you want to look.
Reporting Dashboard sign inNeed access, or lost your login? Email hello@insightequity.co.nz and we will set you up.
01 — The Reporting Dashboard
The whole portfolio, on one screen.
Choose a property or the whole portfolio, choose a period — current month through to full financial year or a custom range — and the dashboard assembles the report: income, expenses, tenancies, arrears, forecast and disbursements.
 DEMO Insight Equity Demo A…
 - Dashboard
— Primary
- Reports
- Owners2
- Properties3
- Tenants4
- Imports
Admin — quick actions
- Add Owner
- Add Property
- Add Tenant
- Add Import
- Settings
- Help & Support
Your reports.
Portfolio reporting across your properties — pick a period and a property to see income, expenses, tenancies and arrears.
- Properties3
- In view3
- Latest dataCurrent period
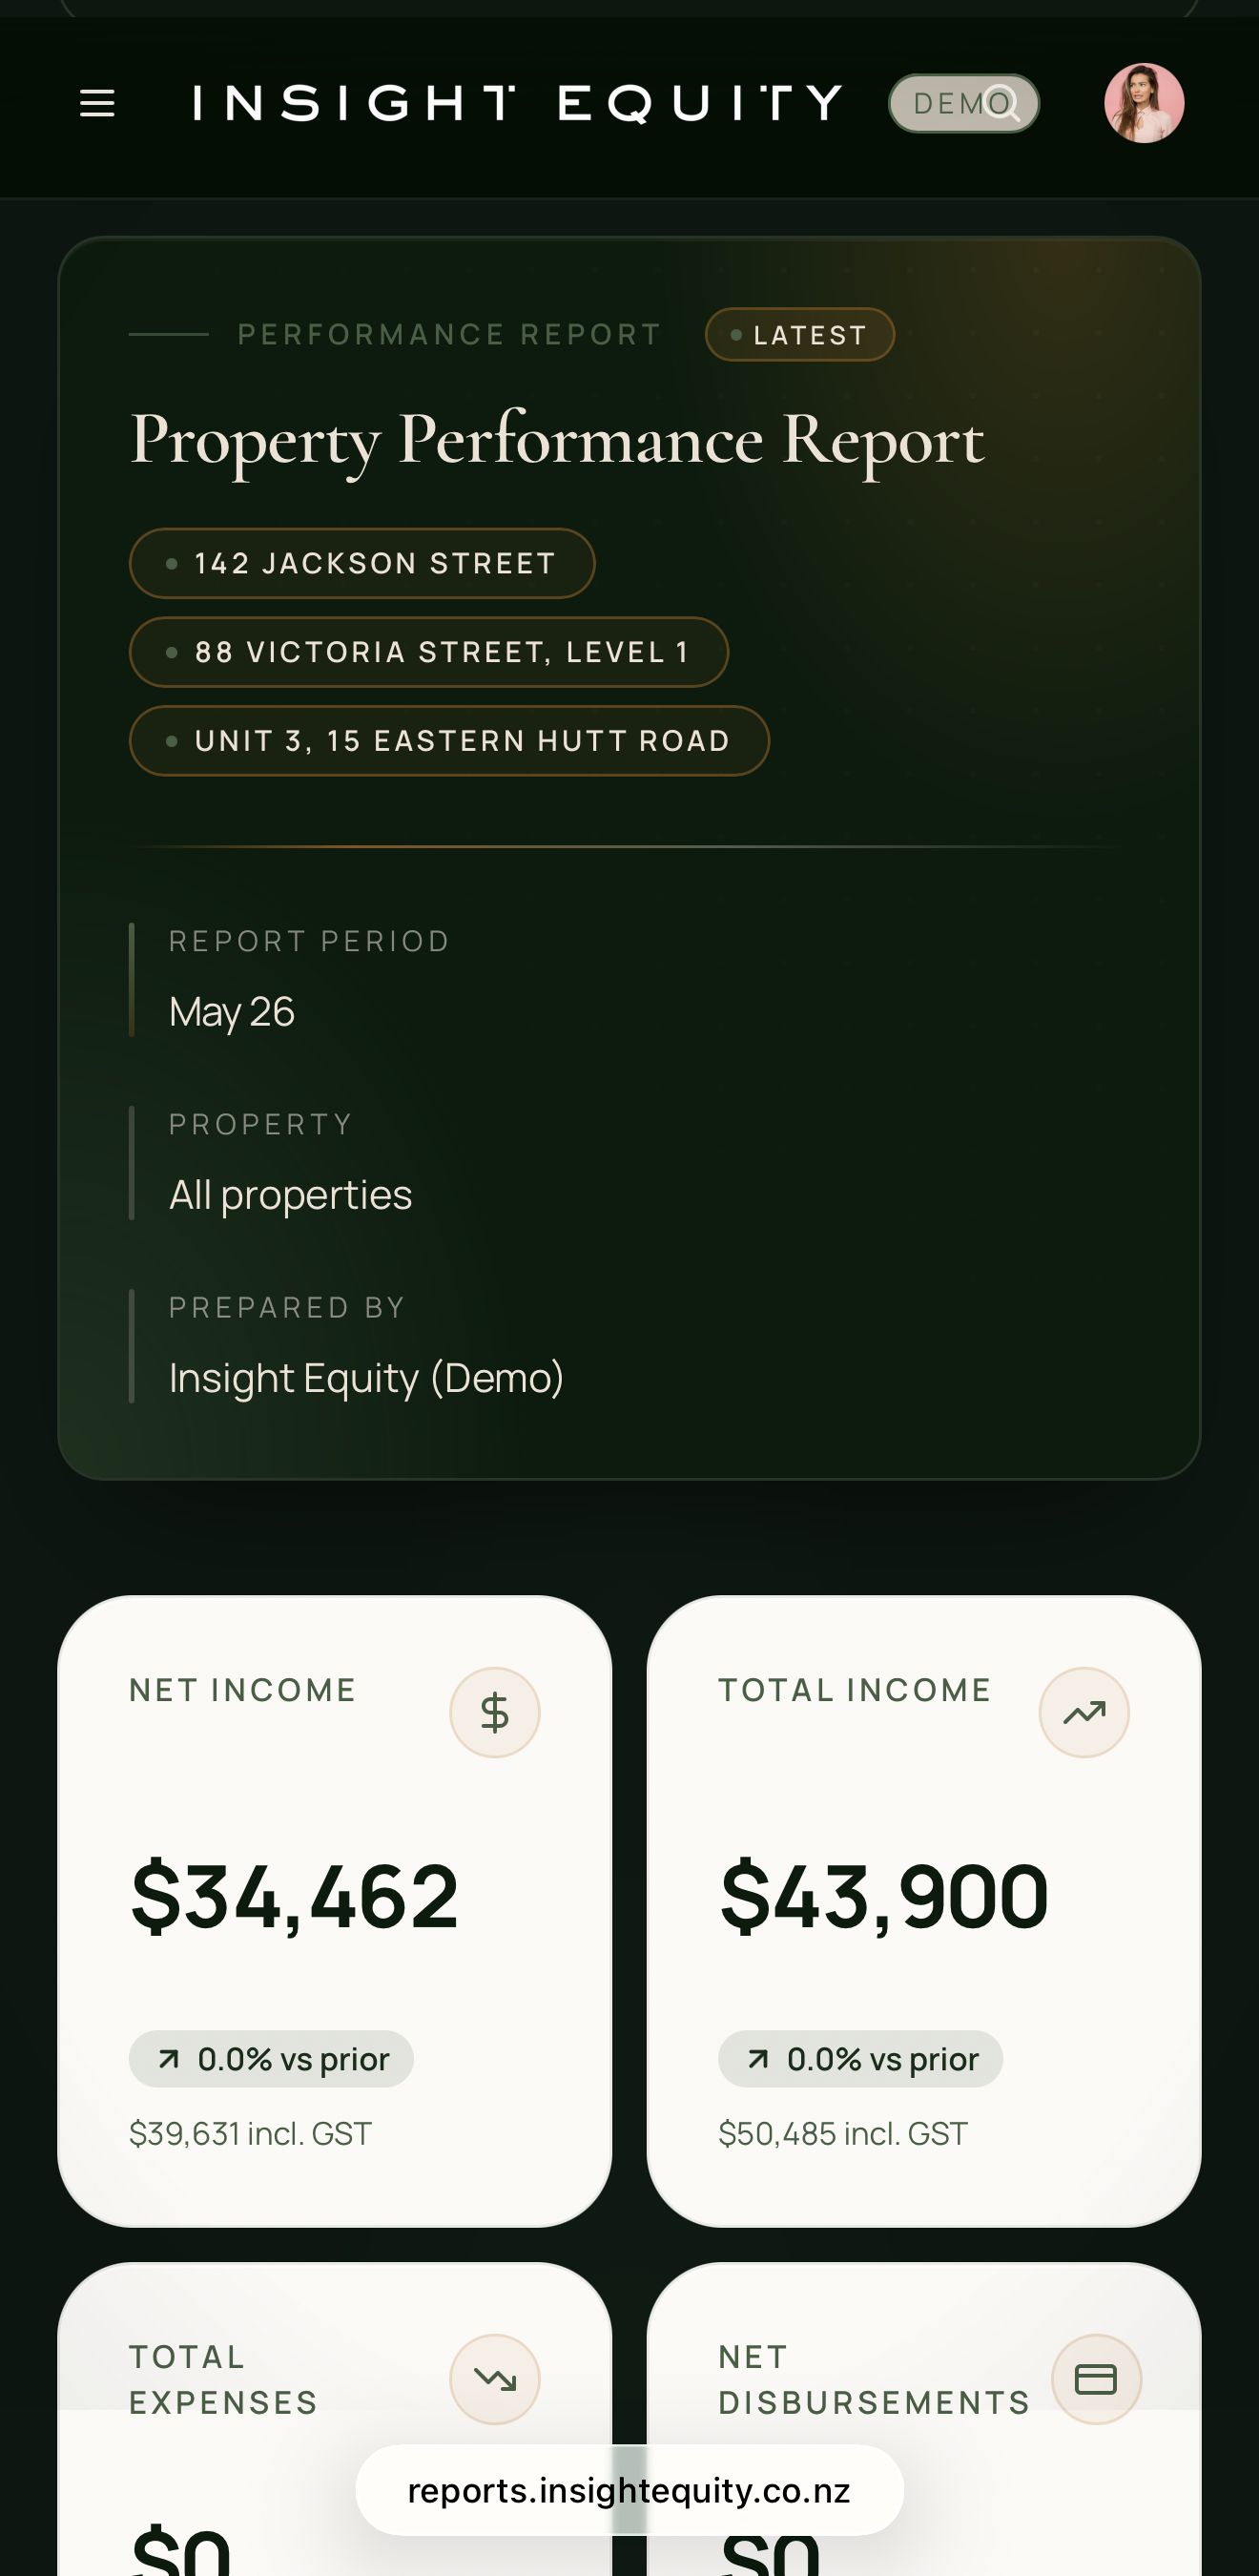
Net income
$34,462
↗ 0.0% vs prior
$39,631 incl. GST
Total income
$43,900
↗ 0.0% vs prior
$50,485 incl. GST
Total expenses
$7,902
↗ 0.0% vs prior
$9,087 incl. GST
Net disbursements
$32,925
↗ 0.0% vs prior
to owners
Occupancy
100.0%
4 of 4 tenancies occupied
Annual rent roll
$526,800
$605,820 incl. GST · $425/m²
Total arrears
$0
0 tenancies affected
WALE
2.8 yr
weighted average lease expiry
Period summary
Income vs Expenses
Totals across the selected period
Period totals
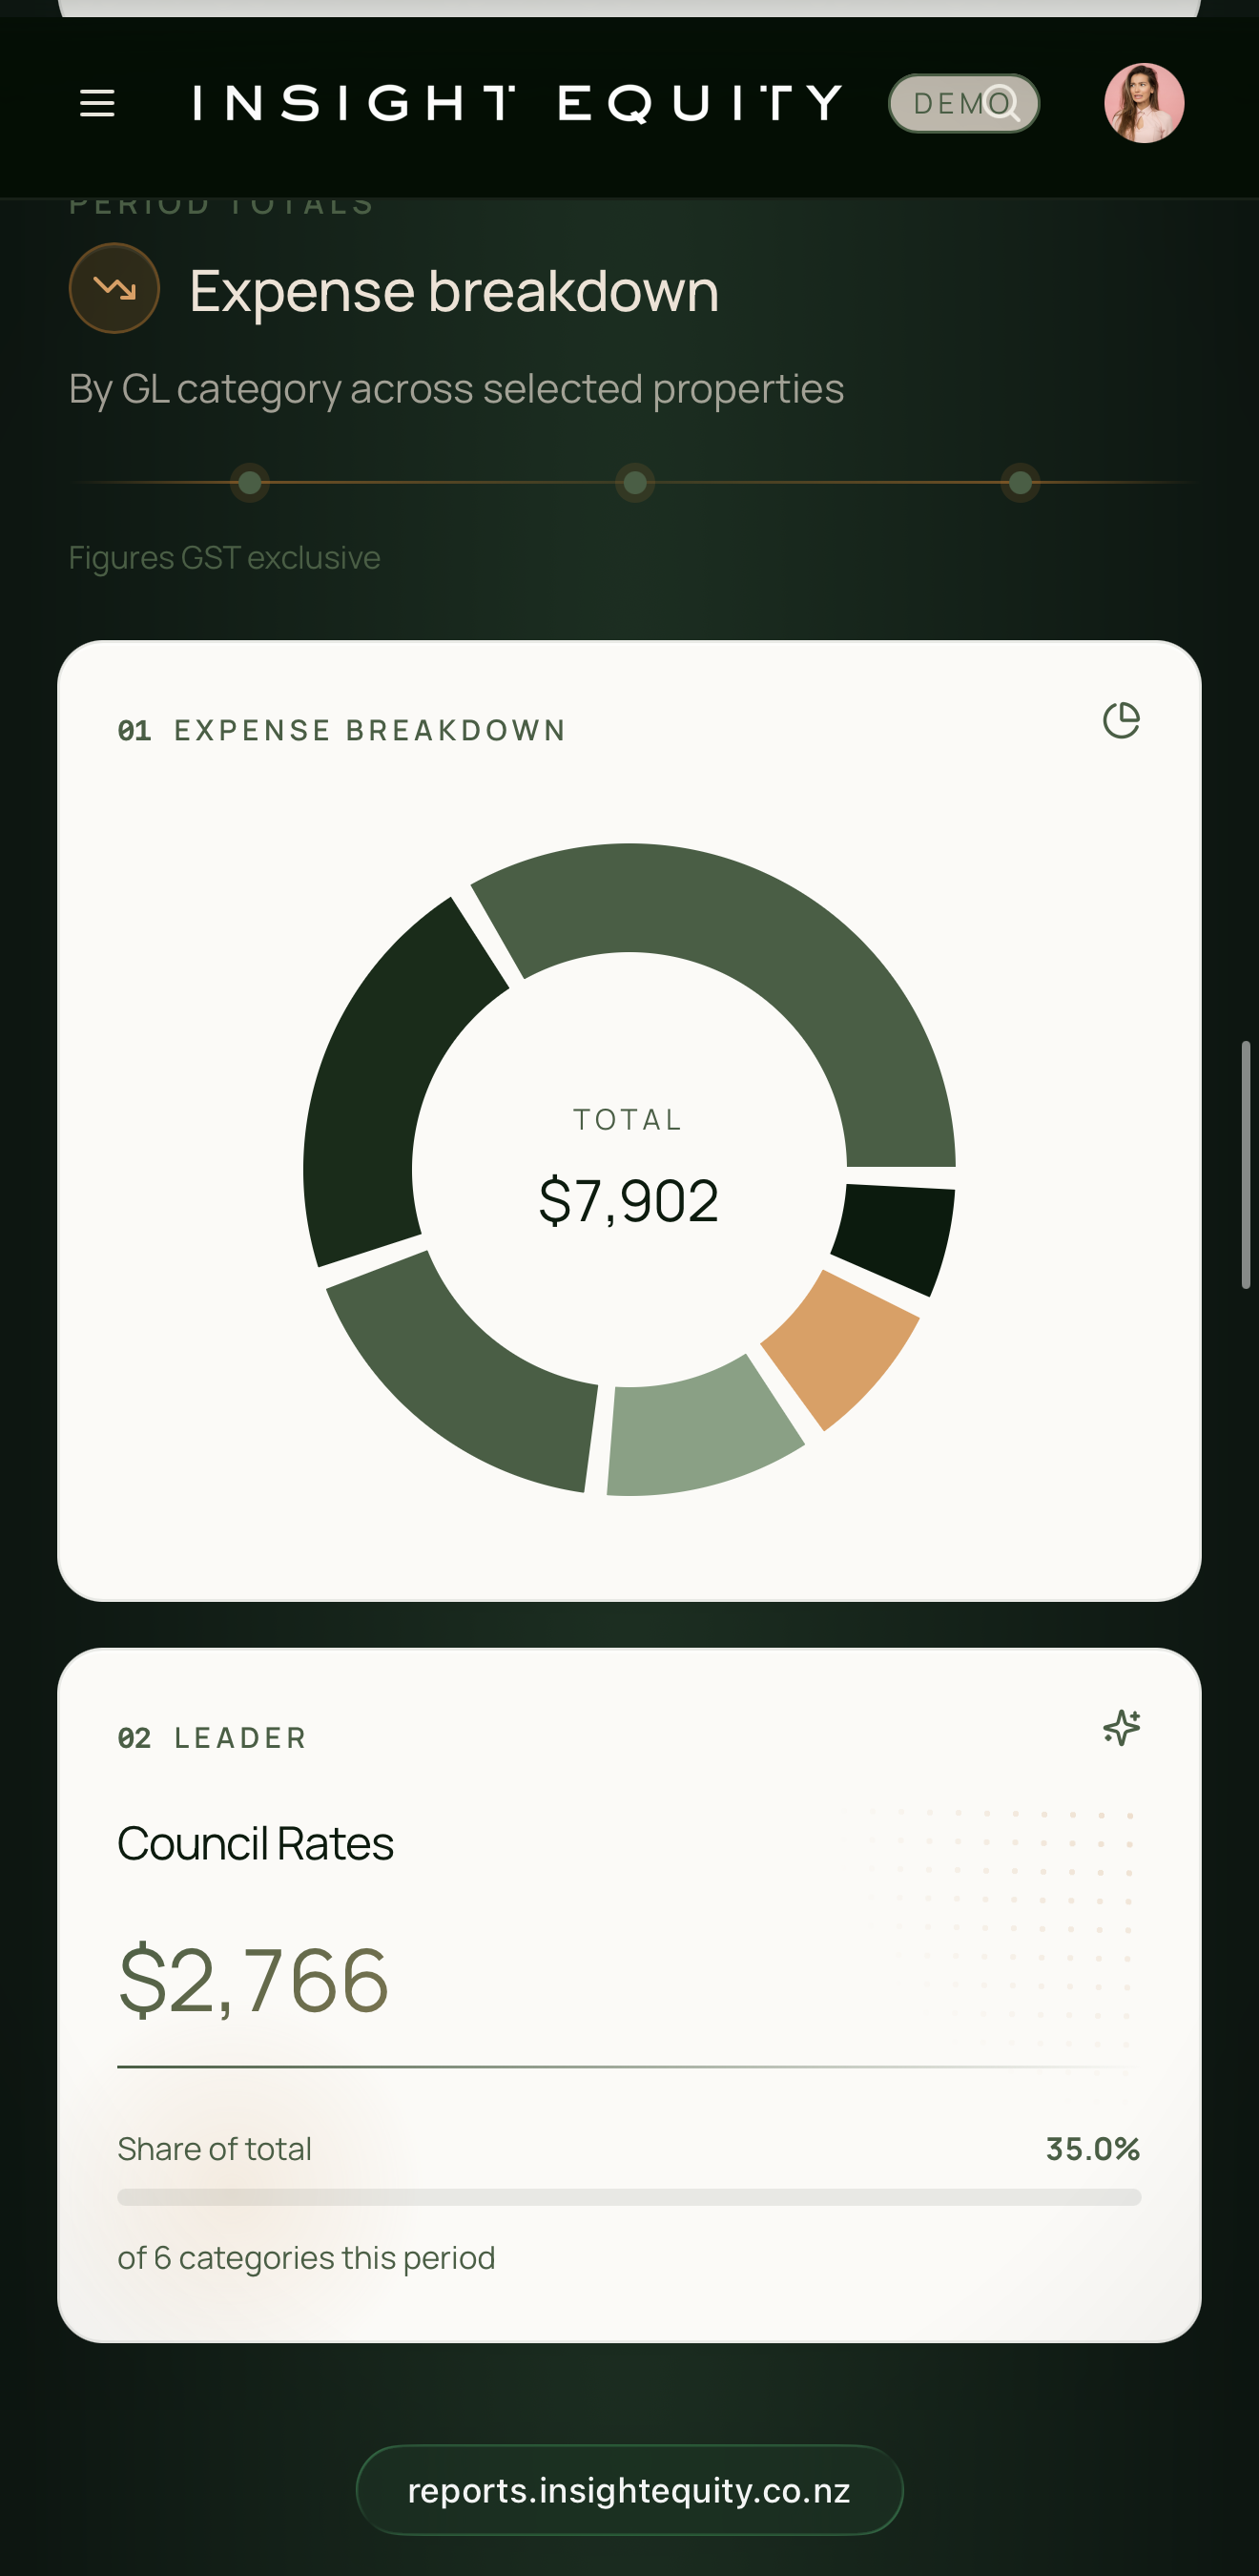
Expense breakdown
By GL category across selected properties
- Council Rates$2,76635.0%
- Repairs & Maintenance$1,73822.0%
- Building Insurance$1,42218.0%
- Cleaning & Caretaking$86911.0%
- Utilities$6328.0%
- Compliance & Inspections$4746.0%
Insight Equity Reporting Dashboard, shown with demonstration data.
Desktop, tablet and phone
The same reporting, wherever you are.
One application, read on a desk or in a car park. No installation, no spreadsheets, and separate access for owners, trustees, accountants and advisers.
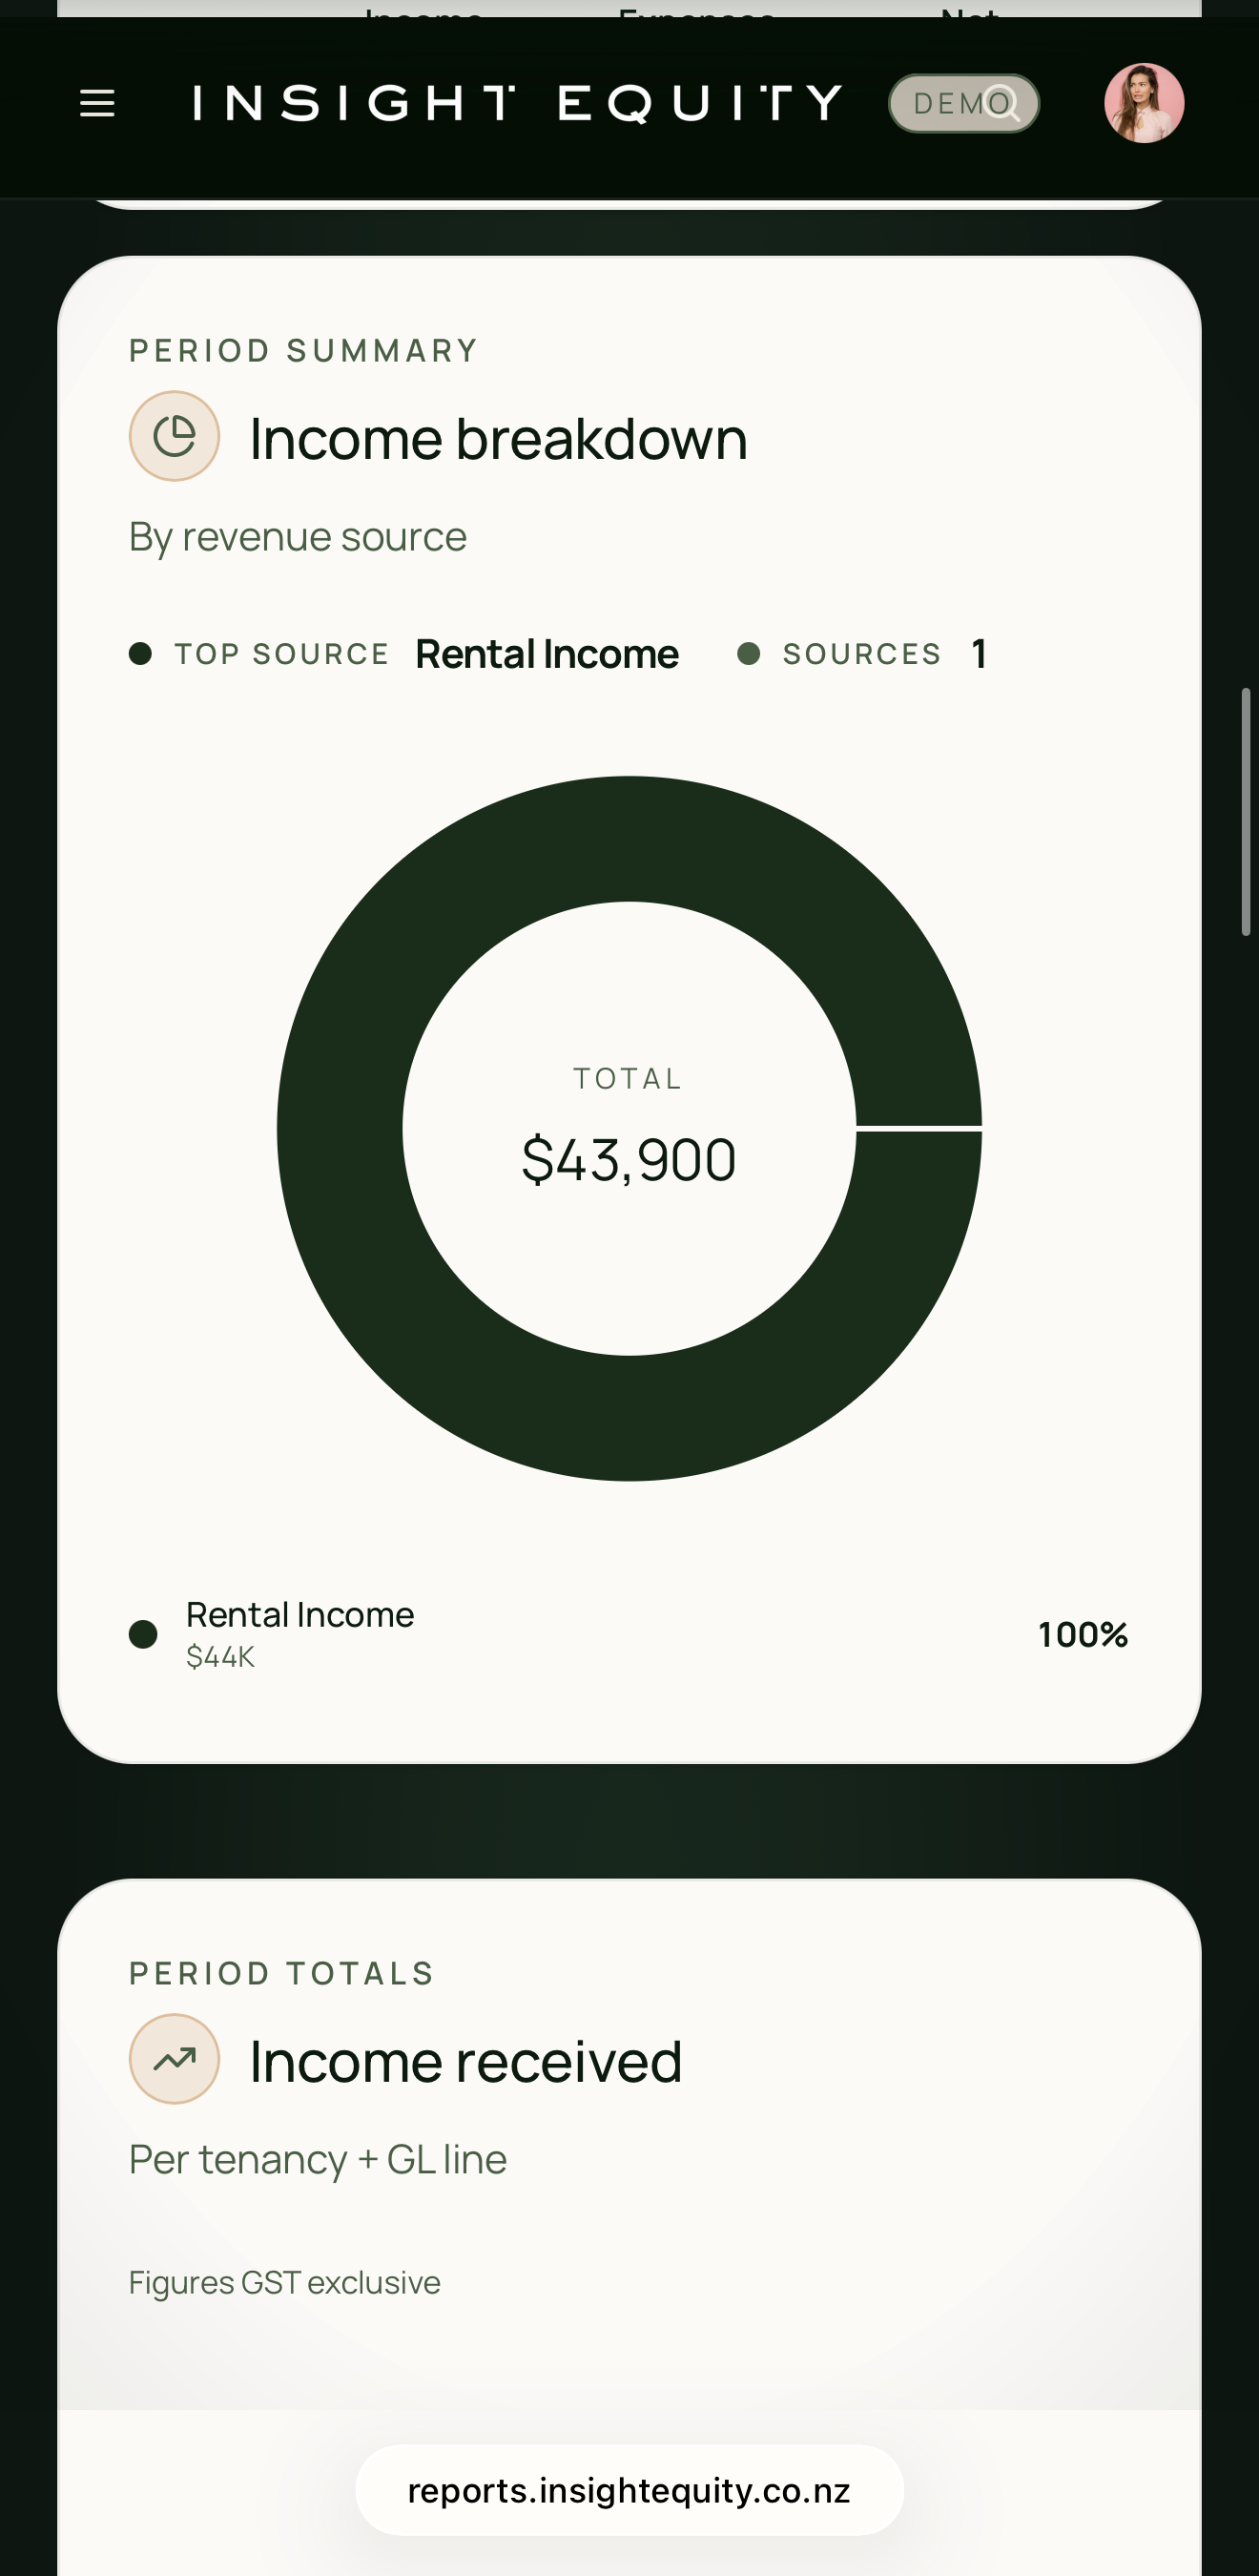
Reporting Dashboard on mobile, shown with demonstration data.
02 — Monthly owner statement
Every dollar accounted for, in plain terms.
 DEMO
DEMO Owner statement — monthly trust summary
88 Victoria Street, Level 1
Monthly reporting period
- Total income17,998.33
- Total expenses−4,380.35
- Management fees−1,034.91
- Owner disbursements−15,000.00
Each month you receive a trust summary that reconciles income, expenditure, fees and disbursements to a closing balance — tenancy by tenancy, invoice by invoice, with GST separated throughout.
- Rent and opex recoveries shown per tenancy, with arrears and unpaid amounts visible
- Every expense itemised by chart of account, payee, reference and date
- GST-ready records for you and your accountant, held in trust and reconciled monthly
03 — End of year investor report
A full year, assessed rather than summarised.
At year end we produce a bound investor report: how the asset performed, what drove the result, how the lease profile shifted, what the tenants think, and what we recommend for the year ahead. It is the document owners take to their accountant, their bank and their co-investors.
- Capitalised value, WALE and passing rental, this year against last
- Tenant feedback surveyed and reported, not assumed
- Every rent review in the year ahead, with our forecast for each
- Concerns raised plainly, with the action we are taking
- Operating expense recovery, benchmarked against comparable buildings

04 — Re-Leased Landlord App
Your property in your pocket.
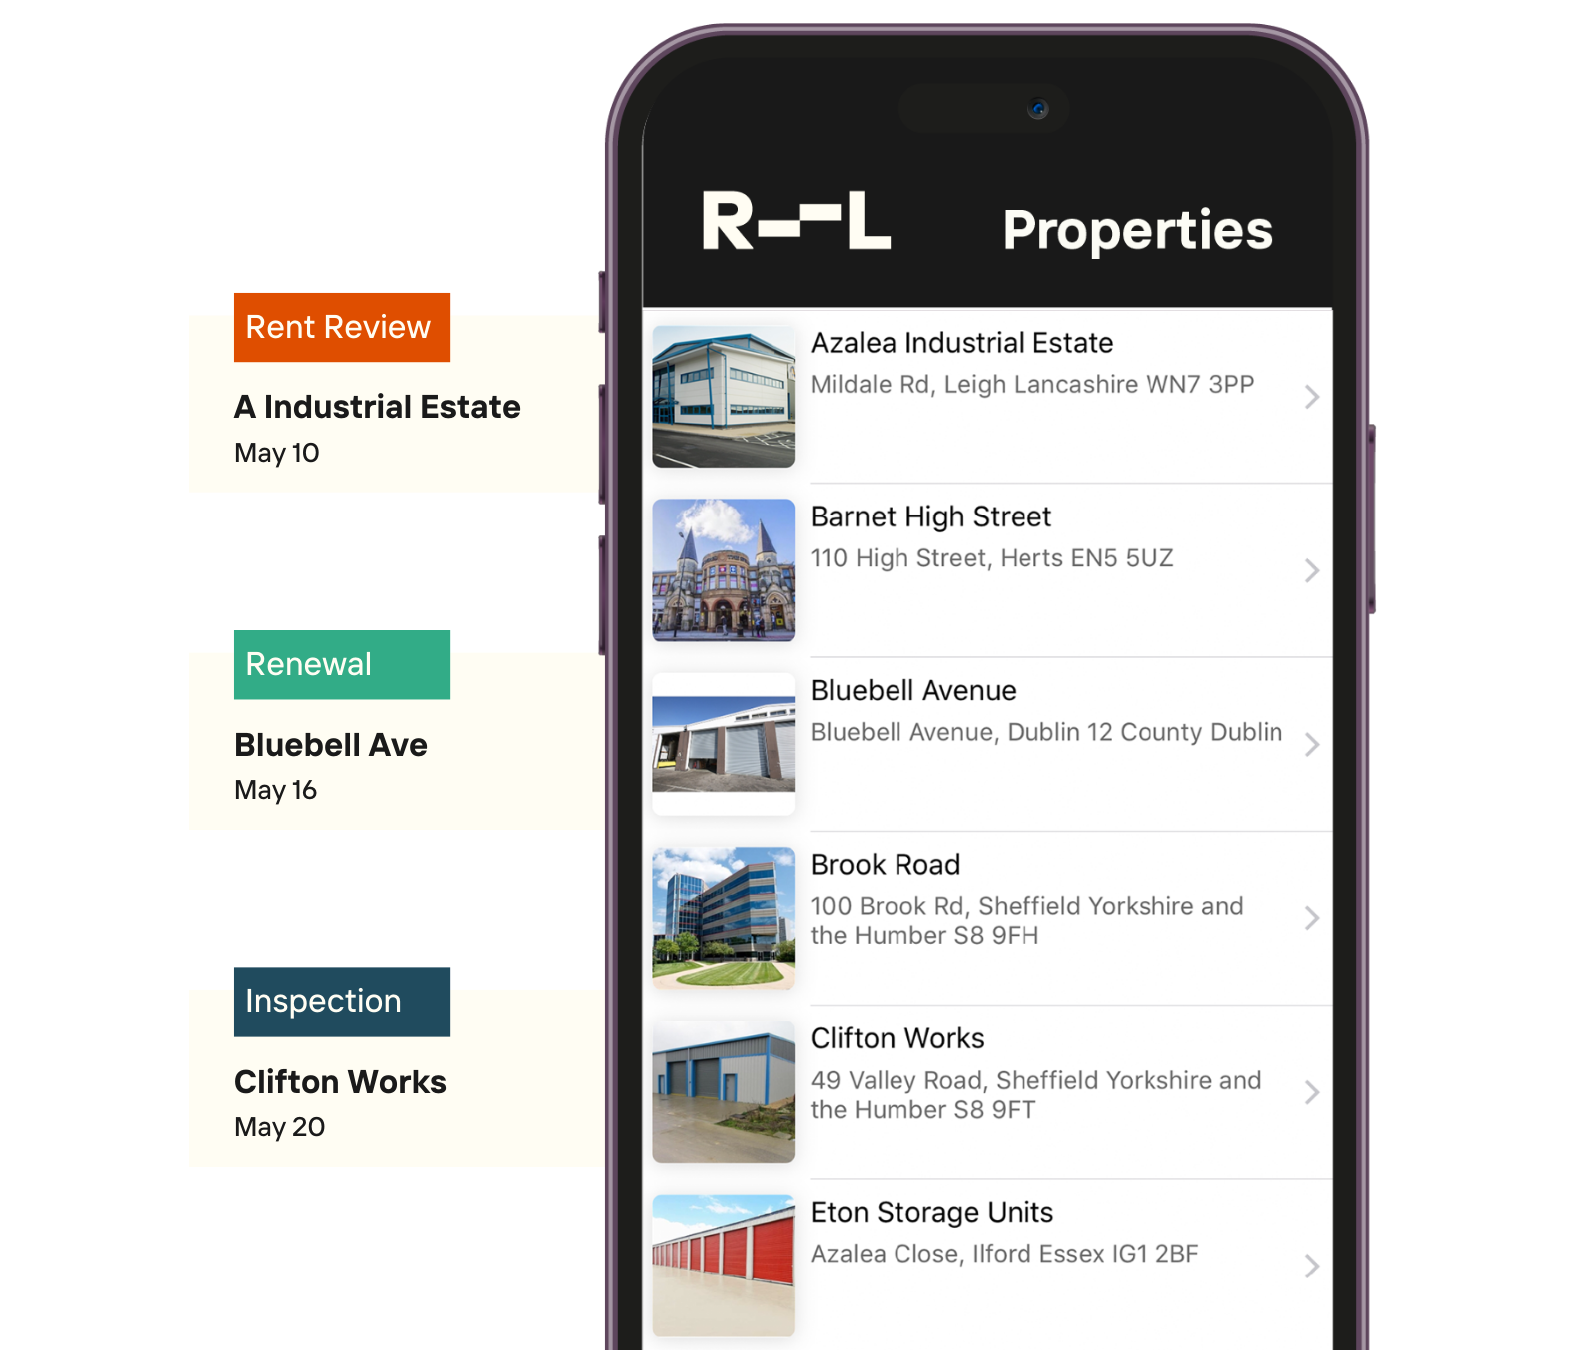
We manage on Re-Leased, the commercial property platform, which gives owners a Landlord App alongside the Reporting Dashboard. Where it is included in your service, you can check income, leases, key dates and documents from your phone at any time.
- Portfolio and property level income at a glance
- Upcoming rent reviews, expiries and compliance dates
- Statements, leases and certificates in one document library
Re-Leased is a third-party platform; app availability depends on your agreed service scope.
The reporting rhythm
Tailored to the property and the ownership objective.
Monthly
Owner report & statement
Financial position, property activity and the decisions in front of you.
Quarterly
Performance review
Budget against actual, arrears trends and progress on planned work.
Annually
Investor report & budget
Full-year assessment, outgoings budget, capital plan and asset strategy.
Any time
Dashboard & app
Current records, documents and financials whenever you want to look.
See a real report, redacted.
We will walk you through an owner statement, an end of year investor report and the dashboard, so you can judge the standard before appointing anyone.
Discuss reporting options